Debugging Tip – Use gdb To Map Assembly With Source Code

With the latest version of gdb (version 7 and above), one can easily map the source code and the assembly listing.  The /m switch when used with the disassemble command gives the assembly listing along with the source code when available.

(gdb) help disassemble
Disassemble a specified section of memory.
Default is the function surrounding the pc of the selected frame.
With a /m modifier, source lines are included (if available).

A sample listing of the disassemble command with the /m switch is pasted below:

(gdb) disassemble /m

11 int y = x +33;
0x004010c1 <+49>: mov -0x4(%ebp),%eax
0x004010c4 <+52>: add $0x21,%eax
0x004010c7 <+55>: mov %eax,-0x8(%ebp)

12 printf("%d\n",y);

0x004010ca <+58>: mov -0x8(%ebp),%eax
0x004010cd <+61>: mov %eax,0x4(%esp)
0x004010d1 <+65>: movl $0x402020,(%esp)
0x004010d8 <+72>: call 0x401198 <printf>

13 return 0;
0x004010dd <+77>: mov $0x0,%eax

14 }
0x004010e2 <+82>: leave
0x004010e3 <+83>: ret 

Note that the assembly language block corresponds to the source line just above it.

gdb – Assembly Language Debugging 101

This article introduces the basic commands required to debug assembly language in gdb.

Note: If you would like to understand an assembly language listing, jump to this article first.

Disassemble

The disassemble command provides the assembly language listing of a program and works even when a program is not running. The command works for a function name / an address / an address range.

disassemble function_name disassembles the function called function_name.

disassemble main

Dump of assembler code for function main:
0x00401180 <main+0>:    lea    0x4(%esp),%ecx
0x00401184 <main+4>:    and    $0xfffffff0,%esp
0x00401187 <main+7>:    pushl  -0x4(%ecx)
0x0040118a <main+10>:   push   %ebp
0x0040118b <main+11>:   mov    %esp,%ebp
0x0040118d <main+13>:   push   %esi
0x0040118e <main+14>:   push   %ebx
------8<---------<snip>---------8<---------------

The disassemble command can also be used for a specific address.

disassemble 0x0040120f

At times the disassembly listing of a function can get very long and to limit it, an address range can be provided as shown below.

disassemble <from_address1> <to_address2>

disassemble main main+20

disassemble 0x004011ce 0x004011f7

Developers who have debugged in assembly on various debuggers on the Windows platform may prefer the Intel instruction set instead instead of the At&T set which is the default in gdb.  The listing can be changed to use the Intel instruction set instead by setting the disassembly-flavor.

set disassembly-flavor intel

disassemble

Dump of assembler code for function main:
0x00401180 <main+0>:    lea    ecx,[esp+0x4]
0x00401184 <main+4>:    and    esp,0xfffffff0
0x00401187 <main+7>:    push   DWORD PTR [ecx-0x4]
0x0040118a <main+10>:   push   ebp
0x0040118b <main+11>:   mov    ebp,esp
0x0040118d <main+13>:   push   esi
0x0040118e <main+14>:   push   ebx
-----8<---------<snip>---------8<--------------

Controlling The Flow Of Program Execution

An instruction breakpoint can be set at a particular address using the breakpoint command.

breakpoint *0x0040118d

Take note of the asterix just before the address above.

To step into the assembly language one instruction at a time use the command:

stepi

Note that this will step into function calls that the program encounters.

To step over a function call, one can use the command:

nexti

To return from a function call that one is current stepping through, use the command:

finish

Gathering Information

To know about the values of the registers of the program being debugged use the following command:

info registers

$pc holds the program counter and it can also be used to find the instruction that will be executed next.

x/i $pc

0x40124e <main+206>:    mov    eax,ebx

Similar to regular debugging, the backtrace command prints the callstack.

bt

To get a list of the shared libraries that are loaded for the current program being debugged the following command is handy to use:

info sharedlibrary

From        To          Syms Read   Shared Object Library
0x779e1000  0x77b1bc3c  Yes         /cygdrive/c/Windows/system32/ntdll.dll
0x77901000  0x779d30c0  Yes         /cygdrive/c/Windows/system32/kernel32.dll
0x75c41000  0x75c895d0  Yes         /cygdrive/c/Windows/system32/KernelBase.dll
0x61001000  0x61450000  Yes         /usr/bin/cygwin1.dll
-----8<---------<snip>---------8<--------------


Note: A handy tip on using the display command during assembly language debugging with gdb was shared in a previous blog entry here.


Debugging – Modifying Code At Runtime

Introduction

The build and debug cycle can be tedious especially when you are unsure whether the change you have in mind solves your problem or not. Sometimes it is good to be able to tweak the logic of your code during a debugging session. This article explains how to make minor adjustments to code without having to rebuild your application.

The article requires tweaking the assembly and dealing with opcodes. If you are not very familar with debugging in assembly, you may want to read this article first. The tips shared here are also useful while debugging libraries where you either do not have the source code or the build environment is unavailable.

Debuggers work on the common principle of launching the executable as a child program and requesting special permissions from the operating system to access and alter the state of the program. This allows it to show and/or modify the memory, registers, code, etc in a debugging session. If a debugger attaches itself to another program already loaded in memory, it requests special permission from the operating system to take control of the program for the purpose of debugging. It will now seem very obvious why the same program in memory cannot be attached by two debuggers at the same time. The operating system caters to the request on a first come first basis and refuses permissions to the second debugger.

The debugger’s access to a program’s memory and registers not only allows users to view the state of the program but also set software breakpoints. Software breakpoints are set by altering and restoring the instructions in memory and has already been covered indepth in an earlier article.

How to modify code at runtime

Altering instructions without compilation of code during debugging works on a similar logic. If one uses the debugger to alter instructions of the program which it controls, then one can essentially change the logic compiled into the executable that is currently loaded in memory. It is worth noting that altering a program in memory is temporary. When the program is restarted and reloaded in memory, all changes are lost and no real harm has been done. As this requires directly tweaking the opcodes in memory, one needs to know how to deal with assembly and this cannot be accomplished with knowledge of a high level language alone.
Independent of the operating system and debugger, the steps needed to change the logic from within the debugger are as follows –

  1. Launch the program in a debugger.
  2. Set a breakpoint in the code at the location which you want to alter execution.
  3. Execute the program and drive the program so that your breakpoint is hit.
  4. Request the debugger to display the disassembly of the code.
  5. Get comfortable with the source-assembly mapping.
  6. Identify the address of the assembly line you would like to alter. Altering usually means changing an if statement to if NOT or “jump if zero” to “jump if not zero”.
  7. Take the address and dump the memory contents at that address. You will see opcodes corresponding to the assembly you just saw.
  8. Modify the memory location with new opcodes (more on this later).
  9. Cross your fingers so that your change won’t cause a crash 🙂
  10. Disable the breakpoint so that execution doesn’t stop too many times at this breakpoint as it makes debugging distracting.
  11. Continue execution and now the program will respond to the new logic in the program.
  12. To undo the effect of change, restart the program.

Example

Let us look at the following simple snippet of code below.


bool flag = true;
if( !flag )
cout &lt;&lt; "flag is false" ;
else
cout &lt;&lt; "flag is true" ;


The code when compiled and run normally would print “flag is true” and this is obvious from the code above. Say we at runtime would like to alter the logic by replacing if(!flag) with if(flag) so that the statement “flag is false” is printed instead.
Let us see how to do this with the two most commonly available debuggers.

GDB

The steps below are in the same order as the generic steps explained earlier.

  • gdb <myprogram>
  • break <line_number_of_if_statement>
  • run   Code will stop at the breakpoint set above.
  • disassemble. The dump on my machine is as follows –

disassemble

0x00401170 <main+32>:   call   0x40f260 <_alloca>
0x00401175 <main+37>:   call   0x410410 <__main>
0x0040117a <main+42>:   movb   $0x1,-0x1(%ebp)
0x0040117e <main+46>:   cmpb   $0x0,-0x1(%ebp)
0x00401182 <main+50>:   jne    0x40119a <main+74>
0x00401184 <main+52>:   movl   $0x443000,0x4(%esp)
0x0040118c <main+60>:   movl   $0x4463a0,(%esp)
0x00401193 <main+67>:   call   0x43e720 <_ZStlsISt11char_traitsIcEERSt13basic_ostreamIcT_ES5_PKc>
0x00401198 <main+72>:   jmp    0x4011ae <main+94>
0x0040119a <main+74>:   movl   $0x44300e,0x4(%esp)
0x004011a2 <main+82>:   movl   $0x4463a0,(%esp)
0x004011a9 <main+89>:   call   0x43e720 <_ZStlsISt11char_traitsIcEERSt13basic_ostreamIcT_ES5_PKc>
0x004011ae <main+94>:   mov    $0x0,%eax
  • Note that main+67 and main+89 are calls to cout. We have now identified the two important statements and the if check should be just above it. It usually helps to corelate the assembly with the source code in this manner.
  • The if check is on lines main+42, main+46 and main+50 (if !(flag==0) ). If we change jne to je, we can negate the if condition and thus alter the logic of the code. The address of the opcode jne above is 0x00401182.
  • x/6x 0x00401182 will dump the opcodes and operands in hexadecimal. In the dump below, 0x75 is the opcode for jne and the operand is 0x16. For details, refer to the Intel instruction set.
0x401182 <main+50>: 0x75 0x16 0xc7 0x44 0x24 0x04
  • set *(char*)0x00401182=0x74 where 0x74 is the opcode for je. Effectively “jump if not equal” has been changed to “jump if equal” thereby inverting the logic of the if statement.
  • cross your fingers.
  • disable 1. Disable breakpoint set earlier.
  • continue

You will observe that as we have modified the runtime code using gdb, the output of the program after the above steps would be “flag is false”.

Visual Studio

Assembly Screen Shot in Visual Studio
The above screen shot shows the debugger displaying the assembly after hitting the breakpoint at the if statement. Do make sure that when you right click in the assembly, “Show Code Bytes” and “Show Address” are checked.
From the screen shot above, the address of jne instruction is 0x003314B8 and its opcode is 0x75. If we modify the opcode at location 0x003314B8 and change it to 0x74 (opcode for je), we effectively negate the if statement at runtime.

To do this, open the memory window (Debug->Windows->Memory->Memory 1) and enter 0x003314B8 in the Address field. The first byte shows as 0x75. Put the cursor on 0x75 and type 74 to change the opcode. You can confirm this by seeing the effect in the disassembly window.

This modifies the code in memory and now when the program execution is continued, the output would be “flag is false”.

Conclusion

Another useful tip to keep in mind is that a lot of code can be disabled at runtime if all corresponding opcodes and operands are replaced with NOPs which has the opcode 0x90 on an Intel machine.  Similarly useful results can also be achived by altering the operands instead of the opcodes.

The ability to change code at runtime is an effective tool for quick debugging though it requires a good understanding of the code at the assembly level.   This technique is meant for small tweaks because it is faster to recompile in case complex changes in assembly are needed.   Moreover, when the program finishes execution, the modification needs to be redone as this technique does not modify the image on the disk.

Assembly And The Art Of Debugging

This article is an introduction to understanding Intel’s assembly language while debugging a computer program.
Debugging in assembly can be a daunting task and not every developer likes to make sense of the mnemonics that appear on the screen.  While debugging, one is normally used to viewing local variables, parameters  and syntax highlighted code in the most user friendly manner and that is the primary reason why many developers dislike debugging in assembly initially.
Why Debug In Assembly?
1.  You have a binary and its corresponding code but the build environment is not functional.  This could be because of missing tools, unavailable compilers and the lack of understanding of complex scripts and steps needed to recreate the binary.
2.  You are dealing with a release build only bug and the debug symbols are unavailable or you are dealing with a third party library and don’t have access to the source code.
3.  You like to have fun.
What You Need?
1.  A debugger that can display assembly language (Visual Studio, WinDbg, gdb, XCode are capable debuggers).
2.  A ready reference to the Intel instruction set.  Google works just fine.
3.  Patience and maybe a link to this article.  🙂
The key to understanding debugging in assembly is to understand how functions are called, parameters are passed, local variables accessed.  The rest can be understood by referring the Intel Instruction set while debugging the assembly code.
The diagram below is roughly how a stack should look like once a function call has been made.  When one encounters assembly, mapping the code to this diagram should simply the debugging experience.  Note that the stack grows downwards.
Passing Parameters To A Function
Parameters are the first to be pushed onto the stack.  The caller of the function pushes them from right to left.
Cleanup Of Parameters
Parameter cleanup may happen in the function that was called (e.g. stdcall calling convention) or by the caller of the function (e.g. cdecl).  Various kinds of calling conventions of the x86 architecture are explained in detailed in this wiki article. http://en.wikipedia.org/wiki/X86_calling_conventions  Looking right after the function call gives a good idea of what convention was being used when compiling the code.
Take note that if cleanup happens in the function being called, variable number of arguments cannot be passed to it.  Whereas it becomes possible to do this if the parameter cleanup happens outside the function.  This essentially is the main difference between stdcall and cdelc calling conventions on a x86 architecture.
The Function Call
Before control is passed to the function, the return address where the program is supposed to resume once the function has finished execution is pushed to the stack.
To recap, parameters are pushed first, followed by the return address.  Later depending on the calling convention of the function, you may see cleanup hhappening right after the function call or within the function itself.
In the diagram above, as the stack grows downwards, the parameters are at the top followed by the return address.
Example
Take a look at the snippet and the equivalent assembly below :
The Function
The function usually starts with a prolog and ends with an epilog
The prolog is either a simple ENTER instruction or more commonly, it saves the ebp register and copies the stack pointer value in it so as to use it as frame pointer.
push        ebp
mov         ebp,esp
The epilog just reverses what the prolog had done.  It is implented by a LEAVE instruction or is implemented as follows
mov         esp,ebp
pop         ebp
The ret instruction returns from the function to the return address stored in the stack.
A compiler switch allows one to omit the frame pointer (fpo – frame pointer omission) which effectively removes the prolog and epilog and uses the ebp register for other optimizations.  It is easy to demarcate function boundaries where the frame pointer is not omitted but one should be aware of the absense of these entry and exit points.
Allocation Of Local Variables
Local variables are allocated on the stack.  The total size of the local variables is computed at compile time and at runtime those many bytes are reserved on the stack.
004113A0  push        ebp
004113A1  mov         ebp,esp
004113A3  sub         esp,0E8h
Note that in the example above, 232 (0xE8) bytes are being reserved for local variables.
The above code will also help in understanding why local variable allocation is much faster than requesting memory from heap.
Local Variables And Parameters In Assembly
The most important part in assembly is to be able to identify access to locals and parameters.  The frame pointer that is set in the prolog, acts as the reference pointer using which all variables can be accessed.  If you add to the frame pointer (Remember : P for Plus and P for Parameters), you will access parameters.  If you subtract from the frame pointer, you will be able to access local variables.
mov         byte ptr [ebp-20h],3
mov         byte ptr [ebp+20h],5
The first line above access a local variable whereas the second accesses a parameter.
In the case of frame pointer omission, everything is calculated with respect to the stack pointer.  Therefore [esp + 20h] might refer to a local or a parameter depending on where the stack pointer currently points to.  And if say a register is pushed on the stack, the same variable will now be referred using [esp + 24h].  Debugging functions that have optimized out the frame pointer is not that easy as the changes made to the stack pointer need to be constantly tracked.

This article is an introduction to understanding Intel’s assembly language while debugging a computer program.

Debugging in assembly can be a daunting task and not every developer likes to make sense of the mnemonics that appear on the screen.

While debugging, one is normally used to viewing local variables, parameters  and syntax highlighted code in the most user friendly manner.  This is the primary reason why many developers dislike debugging in assembly initially.

Why Debug In Assembly?

Debugging in assembly is not an optional skill to have.   Every developer encounters a situation where there is no other alternative other than cracking open the assembly code.  Here are a few reasons why a developer should get their hands dirty with this skill –

  1. You have a binary and its corresponding code but the build environment is not functional.  This could be because of missing tools, unavailable compilers or the lack of understanding of complex scripts and steps needed to recreate the binary.
  2. You are dealing with a release build only bug and the debug symbols are unavailable or you are dealing with a third party library and don’t have access to its source code.
  3. You like to have fun 🙂

What You Need?

  1. A debugger that can display assembly language (Visual Studio, WinDbg, gdb, XCode are capable debuggers).
  2. A ready reference to the Intel instruction set.  Google works just fine.
  3. Patience and maybe a link to this article.  🙂

The key to debugging in assembly is to understand how functions are called, parameters are passed, local variables accessed.  The code flow and logic can be understood by looking up the Intel instruction set .

The diagram below (click for larger image)  is roughly how a stack should look like when a function is called.  Mapping the assembly code to this diagram should simplify the debugging experience.  Note that the stack grows from top to bottom.
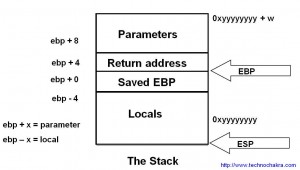
assembly_stack

Passing Parameters To A Function

Parameters are the first to be pushed onto the stack.  The caller of the function pushes them from right to left.

Cleanup Of Parameters

Parameter cleanup may happen in the function that was called (e.g. stdcall calling convention) or by the caller of the function (e.g. cdecl).  Various kinds of calling conventions of the x86 architecture are explained in detail in this wiki article.   Stack cleanup code right after the function call gives a good idea of  the calling convention being used.

Take note that if cleanup happens in the function being called, variable number of arguments cannot be passed to it.  In contrast, variable number of arguments can be implemented if the parameter cleanup happens outside the function.  This essentially is the main difference between stdcall and cdelc calling conventions on a x86 architecture.

The Function Call

Before control is passed to the function, the return address (where the caller is supposed to resume after the function completes execution) is pushed on the stack.

To recap, parameters are pushed first, followed by the return address.  Later depending on the calling convention of the function, you may see cleanup happening right after the function call or within the function itself.

In the stack diagram above, as the stack grows downwards, the parameters are at the top followed by the return address.

Example

Take a look at the snippet and the equivalent assembly below :

[1]int a = 4;
[2]mov         dword ptr [a],4
[3]
[4]char c = 0;
[5]mov         byte ptr ,0
[6]
[7]c = f(a, 22);
[8]push        16h
[9]  mov         eax,dword ptr [a]
[10]  push        eax
[11]call        f (4111D1h)
[12]add         esp,8 
[13]mov         byte ptr ,al
  • In line [8], the constant value 22 (16 hex) is being pushed on the stack.
  • In line [9-10] the variable ‘a’ is pushed.
  • Line [11] is the function call to f() which implicitly pushes the return address.
  • The return value of the function is passed in a register and copied in variable ‘c’ (line[13]).
  • In line [12] one can see that 8 bytes are being discarded from the stack as f() uses the cdecl calling convention and cleanup needs to happen in the caller function.

The Function

The function usually starts with a prolog and ends with an epilog.

The prolog is either a simple ENTER instruction or more commonly, it saves the ebp register and copies the stack pointer value in it so as to use it as frame pointer.

push        ebp
mov         ebp,esp

The epilog just reverses what the prolog had done.  It is implented by a LEAVE instruction or is implemented as follows

mov         esp,ebp
pop         ebp

The ret instruction passes control from the function to the return address stored in the stack.

Compilers provide a switch that allows one to omit the frame pointer (fpo or frame pointer omission) which effectively removes the prolog and epilog and uses the ebp register for other optimizations.  It is easy to demarcate function boundaries where the frame pointer is present but one should be aware that the entry and exit points may be absent.

Allocation Of Local Variables

Local variables are allocated on the stack.  The total size of the local variables is computed at compile time and at runtime those many bytes are reserved on the stack.

004113A0  push        ebp
004113A1  mov         ebp,esp
004113A3  sub          esp,0E8h

Note that in the example above, 232 (0xE8) bytes are being reserved for local variables.

The above code will also help in understanding why local variable allocation is much faster than requesting memory from heap.   Allocating local variables requires moving the stack pointer whereas memory heap management is much more complex.

As the return address and local variable area are very close to each other, buffer overflows can be caused if data is written past the the local variable area which can then overwrite the the return address.   When this return address if forced to point to shell code (or to some other code placed intentionally by a hacker), such a buffer overflow is termed as an exploit.

Local Variables And Parameters In Assembly

The most important part in assembly is to be able to identify access to locals and parameters.  The frame pointer that is set in the prolog, acts as the reference pointer using which all variables can be accessed.  If you add to the frame pointer (Remember : P for Plus and P for Parameters), you will be able to access parameters.  If you subtract from the frame pointer, you will be able to access local variables.

mov         byte ptr [ebp-20h],3
mov         byte ptr [ebp+20h],5

The first line above accesses a local variable whereas the second accesses a parameter.

In the case of frame pointer omission, everything is calculated with respect to the stack pointer.  Therefore [esp + 20h] might refer to a local or a parameter depending on where the stack pointer currently points to.  And if say a register is pushed on the stack, the same variable will now be referred using [esp + 24h].  Debugging functions that have optimized out the frame pointer is not that easy as the changes made to the stack pointer need to be constantly tracked.

Conclusion

Debugging in assembly is not only fun but a useful tool to debug difficult problems.  Different debuggers provide different interfaces to interact with the assembly code but under the hood, all programs work alike.   Understanding this is the key to debugging in assembly with ease.

Cross-platform Debugging Cheat Sheet

If you work on multiple platforms and use different debuggers, you are expected to know the debugger’s user interfaces well enough.  At times this gets confusing especially if you have one primary  platform and you work on other platforms rather infrequently.

I have compiled a list of my favorite features in a debugger and how to invoke them on different debuggers (Visual Studio, XCode, gdb and Windbg).

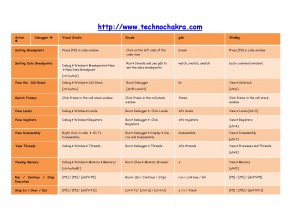
This is not a substitute for the debugger’s documentation but helpful for quickly switching to an unfamiliar debugging environment.  Click the image below for viewing the table or download the PDF version as a ready reference.

Debugger Cheatsheet

Debugger Cheat Sheet (Download PDF)

Please note :

  • The commands (especially for gdb) are not necessarily complete and the debugger’s help should be consulted for detailed usage.
  • The list is not comprehensive and I have only put in my favorite commands that I use while debugging.
  • A square bracket [ ] denotes a keyboard shortcut.

Debugging – Types Of Data Breakpoints In GDB

Data breakpoints are now becoming a part of common breakpoint vocabulary. They help in detecting heap corruption, inadvertent data overwrites and writing past buffer boundaries.

Most programmer’s restrict the definition of data breakpoints to breakpoints that help halting the execution of code in the debugger when memory is written to. This is the kind of breakpoint that helps in catching most of the corruption bugs.

GDB provides data breakpoints (at least on Intel platforms) that do slightly more than that. As data breakpoints are implemented through hardware assistance, it is the hardware platform that provides the different kinds of data breakpoints and the debuggers provide the required interface.

watch

watch is gdb’s way of setting data breakpoints which will halt the execution of a program if memory changes at the specified location.

watch breakpoints can either be set on the variable name or any address location.

watch my_variable
watch *0x12345678
where 0x12345678 is a valid address.

Usually a crash because of heap corruption or invalid outcome due to buffer overruns shows up in the debugger when it is too late to figure out what went wrong. The watch or write data breakpoints can be used to find when a memory location has changed. The debugger at that very instant shows the reason for the inadvertent change.

The cause usually is double deletion of memory, writing to deleted memory, writing past the buffer boundary, etc. In order to fix such issues, it is more important to know when the corruption happens than to know what happens when the corruption has taken place.

Another interesting use of write data breakpoints is to find out the cause of memory leaks in reference counted objects by monitoring the increase and decrease in the reference count of the objects.

rwatch

rwatch (read-watch) breakpoints break the execution of code when the program tries to read from a variable or memory location.

rwatch iWasAccessed
rwatch *0x12345678
where 0x12345678 is a valid address.

For example, say you are new to your project and would like to figure out where exactly are your encryption routines in code. As a start, you can first search your codebase but you may hit a few false positives. If you know the memory location of your password and you set your rwatch breakpoints correctly, it would not be long before the debugger breaks execution right in your encryption algorithms which have to read the password in order to perform their function. Getting evil ideas already?

Another use of read data breakpoints is finding out the code that is reading from memory that has already been deleted and is using this corrupt information later.

awatch

awatch or access watches break execution of the program if a variable or memory location is written to or read from. In summary, awatches are watches and rwatches all in one. It is a handy way of creating one breakpoint than two separate ones.

awatch *0x12345678
where 0x12345678 is a valid address.

The problem with data breakpoints like any other breakpoint is that they can be triggered far too many times and the programmer may lose track of the problem being debugged. To ensure the breakpoints are hit the least number of times, the data being worked upon should be minimal and the breakpoint should be set as late as possible.

Temporary Breakpoint – Now You See It, Now You Don’t

Have you faced the problem of breakpoint clutter where breakpoints keep piling up only to hinder the debugging session?  It is then that one realizes that there are some breakpoints that can be deleted and others disabled.

A useful feature in a debugger is a temporary breakpoint that automagically gets deleted when hit thereby reducing the clutter of unnecessary breakpoints.  These breakpoints are useful when you wish to stop at a code location only once and do not require the execution to stop at that location ever again.

For example, say you are trying to determine whether a particular test scenario invokes a specific line of code or not, in that case a temporary breakpoint can be used as the breakpoint is not useful once it has been hit alteast once.

Below are steps on how to set temporary breakpoints in various debuggers.

gdb

Use the tb command to set a temporary breakpoint in gdb.  It is similar to the break command but the breakpoint will automatically be deleted when hit.

(gdb)help tb
Set a temporary breakpoint.
Like “break” except the breakpoint is only temporary,
so it will be deleted when hit.  Equivalent to “break” followed
by using “enable delete” on the breakpoint number.

Windbg

In Windbg, breakpoints set in the Command window using the bl /1 command can be used to create temporary breakpoints.  The /1 tells Windbg that the breakpoint should be deleted when hit.

In Windbg temporary breakpoints are also known as “one shot breakpoints”.

Visual Studio

I found it a bit painful to create temporary breakpoints in Visual Studio.  The only way I could create one was by setting a breakpoint and then setting the hit count for the breakpoint to be equal to 1.   The  article here explains how to set a hit count in Visual Studio.

The amount of work involved to do this sometimes doesn’t make temporary breakpoints worthwhile to set.  Moreover the breakpoint lingers on and doesn’t actually get deleted when hit.

GDB – Debugging In Assembly

If you haven’t debugged in assembly yet, you haven’t debugged enough 🙂  Debugging assembly in gdb can be tricky at times.

A normal debugging session involving assembly language consists of the following steps –

  1. Launch the program in gdb and set the required breakpoint(s).
  2. When the breakpoint is hit, use the disassemble command to view the assembly language of the current frame.
  3. Use the frame command and figure out the program counter and thus your location in the assembly that gdb produced in the last step.
  4. Use the si and ni commands to step in and step over the instructions in assembly language.

The problem is that this may require a bit of scrolling to do if the disassembled function is very long.  The display command can be used to solve this problem.

The display command in gdb allows a user to configure the variables that should show up each time the program is suspended.

(gdb) help display
Print value of expression EXP each time the program stops.
/FMT may be used before EXP as in the “print” command.
/FMT “i” or “s” or including a size-letter is allowed,
as in the “x” command, and then EXP is used to get the address to examine
and examining is done as in the “x” command.

With no argument, display all currently requested auto-display expressions.
Use “undisplay” to cancel display requests previously made.

One can use the display command to view the next instruction that is about to be executed.  The pointer to the instruction yet to be executed is stored in the computer’s program counter (also known as the instruction pointer).   The following command will show the next 3 instructions that are pointed to by the program counter.

display /3i $pc

The /3i above causes three instructions to be printed and $pc references the program counter register.  A sample output is shown below.

1: x/3i $pc

0x401175 <main+37>:     call   0x4103f0 <__main>
0x40117a <main+42>:     lea    0xffffffe8(%ebp),%eax
0x40117d <main+45>:     mov    %eax,(%esp)
(gdb)


Debugging – Using Breakpoint Hit Count For Fun And Profit.

If you are familiar with hit count breakpoints already, you may want to click here to jump to the advanced tricks shared in this article.

What is the hit count of a breakpoint?

A debugger allows users to set a breakpoint at a specific line in code.  When the execution reaches that line, the breakpoint is said to have been *hit* and the execution of program being debugged is suspended.

Internally the debugger also keeps a count of the number of times the breakpoint has been hit.  This is called the hit count of a breakpoint.  Debuggers allow users to set conditions based on the hit count of the breakpoint.  For example, you can specify that the execution of the program should only be suspended when the hit count is greater than or equal to 250. To put it in other words, the breakpoint will be skipped for the first 249 times it is hit.

The advantage of being able to set a condition with the hit count of a breakpoint is to make the process of debugging faster.


How can hit count based breakpoints be set?

Debuggers today have either a command line or a graphical user interface.  Mostly all debuggers provide a means to set hit count based breakpoints. Below are steps on setting such breakpoints in some of the debuggers I have used.

Microsoft Visual Studio 2005

  1. Set a breakpoint at a line in your code.
  2. Right click the breakpoint and then click on “Hit Count”.  You can also go to Debug -> Windows -> Breakpoints  and right click on the breakpoint that was just created and select “Hit Count”.
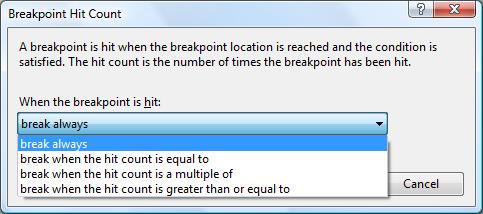
  3. In the dialog that pops up, you can choose from four ways of controlling the breakpoint based on its hit count.  The default is to ignore the hit count and suspend the program always when the breakpoint is hit. It is good to take note of the other three options.
Hit Count Window In Visual Studio 2005

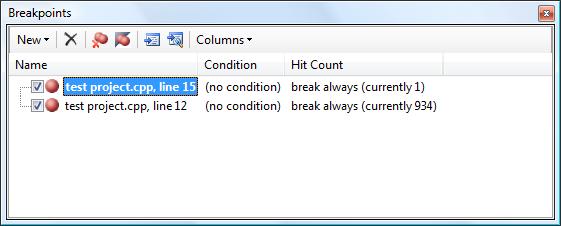
When the program is in suspended mode, one can see the current hit count of the breakpoint in the breakpoint window.  In the image below, the “Hit Count” column shows the current hit count of the breakpoints.

Visual Studio Breakpoint Window

gdb

In gdb, the command continue is used to resume execution of the suspended program. When followed by a number N, the breakpoint is hit the Nth time.

(gdb) help continue
Continue program being debugged, after signal or breakpoint.
If proceeding from breakpoint, a number N may be used as an argument,
which means to set the ignore count of that breakpoint to N – 1 (so that
the breakpoint won’t break until the Nth time it is reached).
(gdb) continue 20

gdb is available on Mac OSX, Linux, AIX, Solaris, HPUX and Cygwin on Windows, etc so this is one command one should learn by heart.

On Mac OSX, the XCode IDE uses gdb internally and allows access to it through the menu (Debug -> Console Log).  Through the command line interface continue can be used as described above.

In gdb the info breakpoints command can be used to view the current hit count of all breakpoints.

(gdb) info breakpoints
Num Type           Disp Enb Address    What
1   breakpoint     keep y   0x0040118a in main at try.cpp:6
breakpoint already hit 246 times
3   breakpoint     keep y   0x004011a5 in main at try.cpp:8

Visual Studio and gdb differ slightly in terminology.  One allows setting breakpoints with a hit count and the other lets skipping of breakpoints for a certain count.  However they are essentially the same features that allows the programmer the option of not having to stop always at a breakpoint.  In the subsequent sections, the term “set a hit count breakpoint” is used instead of “skip the breakpoint n times”.  It should be trivial to interpret the tricks in terms of skipping a breakpoint.


WinDbg

I did not find a way to set hit count breakpoints in windbg yet.
Here is how you set a hit count breakpoint in WinDbg.

  1. Go to the source view and set a breakpoint in the source code.  The shortcut F9 can be used to toggle a breakpoint.
  2. In the command window (alt + 1), list all breakpoints using the bl command.
  3. Take note of the breakpoint that you just set and copy the location of the breakpoint which is listed in the format of <module_name>!<function_name>+<offset>.  See example below.
  4. Now redefine the breakpoint with the bp command.  After the bp command paste the location that you copied in the previous step followed by the hit count.

0:000> bl

1 e x86 00000000`004113b2     0001 (0001)  0:**** test_project!wmain+0x42
0:000> bp test_project!wmain+0x42 2300
breakpoint 1 redefined
0:000> bl
0 e x86 00000000`004113b2     2300 (2300) 0:**** test_project!wmain+0x42

The hit count in the above example is set to 2300.  This current  hit count as shown above is decremented each time the breakpoint is hit but the execution stops only when this number is equal to 1.  The number within the parentheses denotes the hit count that was originally set by the user. 

Using Hit Count For Fun And Profit

Many developers set breakpoints without the hit count conditions.  There are lot of nifty ways in which a hit count breakpoint can be used.

Below are some scenarios which developers will find useful while using hit count breakpoints:

Break In A Loop More Conveniently.

Setting an unconditional breakpoint in a loop (e.g. for, while, do-while) may break execution more often than needed.  If you know the iteration of the loop when you want to suspend execution of the program, you can set a hit count breakpoint.

For example, in the while loop below if the intention is to break in the 21stiteration,  a hit count based breakpoint will be more useful and simpler than a conditional one.  Do note that in the loop below, the variable i does not increment by one.

<code>int i = 0;
while( !flag &amp;&amp; i &lt; N )
{
/* some code */
i *= 2;
}</code>

Likewise, the for-loop below traverses through the int vector using an iterator.  If the intent is to break when the 10thelement in the vector is being processed in the loop, then a hit count breakpoint will be more useful and easy to set.

<code>std::vector&lt;int&gt;::iterator iter;
for( iter = vec.begin() ; iter != vec.end() ; ++iter )
{
/* some code */
}</code>


Create A Quick And Dirty Profiler And Much More.


Part I

Profilers that instrument code log the time taken by a function and the number of times it is called.  It is the latter where hit count breakpoints are very useful.  The greatest advantage of being able to track the number of times a function is called is that you don’t have a to run the code through a profiler but you get the results with the same accuracy.  Moreover profilers may crash at times but debuggers are pretty stable when it comes to debugging code.

The trick here is to set a hit count breakpoint that will never be reached.  For example, set a hit count to an unpractically large value (say 1000000) and set one breakpoint at the program termination (for example at the end of the main() function).

When the program is run, due to the large hit count, the breakpoint will never be hit and only the breakpoint at the end of the program will be hit.  The debugger however has no knowledge that the breakpoint hit count is too large for it to be hit and therefore tracks the count whenever execution reaches the breakpoint.

At program termination, when the program gets suspended due to your second breakpoint, you have the debugger waiting to tell you what the hit count of the first breakpoint currently is.  In other words it just told you how many times did the line of code get hit before the program terminated.  That exactly is the kind of information that the profiler would have told you.  Voila – you have that quick and dirty profiler ready for use :-).

Maybe someday I will write about how how a breakpoint works internally and then you can relate the similarity between what do the debugger and code instrumenting profiler have in common.

The above trick is explained in the C code snippet below.

<code>
void profile_me()
{
/* set hit count breakpoint here with a very large hit count */
/* function code */
}</code>

<code>
int main()
{
profile_me();
/* Set the second breakpoint here and when this is hit,*/
/* observe the hit count of the breakpoint set above */
return 0;
}</code>

Part II – Smart Breakpoints

Another use of hit breakpoints is very similar to the quick and dirty profiler trick.  At times when one encounters a crash in a loop or in a repeated function call, it may make more sense to debug a few iterations prior to when the crash actually happens.  For example,  say a loop is processing tokens  and a crash happens while processing the 2520th token.  The crash itself may not make much sense once it has occured but it may help to know what happened 5 iterations prior to the crash.  That way, the programmer  can collect data for prior iterations and reach the crash condition.   This will equip the programmer with relevant data needed to solve the crash at hand.

<code>while( token = get_token() )
{
/* some code */
switch( token )
{
case token_1: /*do code */
case token_2: /*do code */
/* more case statements */
}
}</code>

The trick here again is to set a very large hit count so that the breakpoint is never hit.  Once the crash occurs, the hit count of the breakpoint is noted.  Then the hit count of the breakpoint is reset to 5 minus the hit count obtained when the crash had occured.  From now on whenver the hit count condition is met and the breakpoint is hit, the programmer will know that in 5 iterations a crash is expected.  The data collected for the 5 iterations may be essential for resolving the crash.


Part III – Matching calls.

Hit count breakpoints have yet another use in debugging – matching the call count for a pair of functions.  For example, for every malloc call a free call should have been made in order to have zero memory leaks.  Similarly, a constructor (for now assume there is only one) and a destructor of a class should be called equal number of times.  These calls have an opposite effect but their pair should match to ensure that resources don’t leak.

<code>
C::C()
{
/* constructor */
}</code>

<code>~C::C()
{
/* destructor */
}
</code>

The trick is to set two hit count breakpoints with very large values that will never be reached in both the constructor and destructor above.  Also a breakpoint should be set at the point of program termination (for example at the end of function main() ).  The two breakpoints in the constructor and destructor will not be reached due to the very large values.  When the program’s execution is suspended at program termination due to the final breakpoint, the hit count of the two breakpoints set in the constructor and destructor should be checked and hopefully their hit counts should match.  Here I am assuming the class C was not involved in creating global or static objects.  A mismatch of hit counts may suggest that not all objects of class C were destroyed and a possible resource leak should be looked into.

In summary, if there are two calls that should be called equally during the life span of a program, then this trick can be used to check that the call hit counts do indeed match.


Final Note

Hit count is a slightly under used feature of a debugger but it can be used in many innovative ways to gain better control over debugging.  It is not a replacement for profilers but a great tool when you do not have one with you at hand.  The infinite-hit-count-breakpoints are useful to keep track of code workflow as these breakpoints are set with the intention of never wanting them to be hit.  However the information that such breakpoints can provide can be pretty useful and accurate.