strace Those Crashes On Linux

strace is a great tool on Linux that every developer should be aware of.  It helps trace system APIs – the APIs used, parameters passed and the error value returned.   It does not require root permissions to run.  You can generate a system call trace on a command that is executed or you can trace an already running process.

Sample Usage

strace ./my_crashing_binary

strace ./my_crashing_binary 2>out.txt

strace -p 12345 2>out.txt

The strace Output

A sample output of strace is given below –

<snip>
old_mmap(NULL, 4096, PROT_READ|PROT_WRITE, MAP_PRIVATE|MAP_ANONYMOUS, -1, 0) = 0xb7fe1000
mprotect(0x645000, 4096, PROT_READ) = 0
mprotect(0x51a000, 4096, PROT_READ) = 0
set_thread_area({entry_number:-1 -> 6, base_addr:0xb7fe16c0, limit:1048575, seg_32bit:1, contents:0, read_exec_only:0, limit_in_pages:1, seg_not_present:0, useable:1}) = 0
munmap(0xb7fe3000, 115297) = 0
fstat64(1, {st_mode=S_IFCHR|0620, st_rdev=makedev(136, 5), ...}) = 0
mmap2(NULL, 4096, PROT_READ|PROT_WRITE, MAP_PRIVATE|MAP_ANONYMOUS, -1, 0) = 0xb7fff000
write(1, "Hello World\n", 12) = 12
brk(0) = 0x940e000
brk(0x942f000) = 0x942f000
open("/myfile", O_RDONLY) = -1 ENOENT (No such file or directory)
--- SIGSEGV (Segmentation fault) @ 0 (0) ---
+++ killed by SIGSEGV (core dumped) +++

In the above example each line of the strace output has the system call, the parameters passed to it and the return value.

Take note that just before the above program crashed, it tried to access /myfile. With experience it is not hard to guess that the file is being accessed even though it was not found.  Either this file is absolutely necessary for the program to run or the required error checks are missing that could have averted the crash.

When Is strace Useful?

strace is very useful while debugging crashes.  Some scenarios where strace can be helpful are –

  1. Debugging why an installation crashes on a machine.
  2. Detecting file contention issues such as a file name clash while creating temporary files.
  3. Debugging random crashes that are most probably due to the program running out of memory or due to it requesting an arbitrarily large chunk of memory.
  4. Finding out how the program interacts with the file system.
  5. Debugging crashes reproducibly only on one machine.
  6. Debugging crashes in unfamilar code or in cases when sources are unavailable.

More Information

This article is meant as a pointer to the strace utility but it is not a substitute for the man page.  Go to the man page to explore all options strace provides.

man strace

strace is not a substitute for a debugger but a lightweight tool which can be used to generate logs, diagnose common problems and study the usage of system calls in a program.  Like any other program in a programmer’s toolset, it can save a lot of debugging time if used at the right time.



Temporary Breakpoint – Now You See It, Now You Don’t

Have you faced the problem of breakpoint clutter where breakpoints keep piling up only to hinder the debugging session?  It is then that one realizes that there are some breakpoints that can be deleted and others disabled.

A useful feature in a debugger is a temporary breakpoint that automagically gets deleted when hit thereby reducing the clutter of unnecessary breakpoints.  These breakpoints are useful when you wish to stop at a code location only once and do not require the execution to stop at that location ever again.

For example, say you are trying to determine whether a particular test scenario invokes a specific line of code or not, in that case a temporary breakpoint can be used as the breakpoint is not useful once it has been hit alteast once.

Below are steps on how to set temporary breakpoints in various debuggers.

gdb

Use the tb command to set a temporary breakpoint in gdb.  It is similar to the break command but the breakpoint will automatically be deleted when hit.

(gdb)help tb
Set a temporary breakpoint.
Like “break” except the breakpoint is only temporary,
so it will be deleted when hit.  Equivalent to “break” followed
by using “enable delete” on the breakpoint number.

Windbg

In Windbg, breakpoints set in the Command window using the bl /1 command can be used to create temporary breakpoints.  The /1 tells Windbg that the breakpoint should be deleted when hit.

In Windbg temporary breakpoints are also known as “one shot breakpoints”.

Visual Studio

I found it a bit painful to create temporary breakpoints in Visual Studio.  The only way I could create one was by setting a breakpoint and then setting the hit count for the breakpoint to be equal to 1.   The  article here explains how to set a hit count in Visual Studio.

The amount of work involved to do this sometimes doesn’t make temporary breakpoints worthwhile to set.  Moreover the breakpoint lingers on and doesn’t actually get deleted when hit.

GDB – Debugging In Assembly

If you haven’t debugged in assembly yet, you haven’t debugged enough 🙂  Debugging assembly in gdb can be tricky at times.

A normal debugging session involving assembly language consists of the following steps –

  1. Launch the program in gdb and set the required breakpoint(s).
  2. When the breakpoint is hit, use the disassemble command to view the assembly language of the current frame.
  3. Use the frame command and figure out the program counter and thus your location in the assembly that gdb produced in the last step.
  4. Use the si and ni commands to step in and step over the instructions in assembly language.

The problem is that this may require a bit of scrolling to do if the disassembled function is very long.  The display command can be used to solve this problem.

The display command in gdb allows a user to configure the variables that should show up each time the program is suspended.

(gdb) help display
Print value of expression EXP each time the program stops.
/FMT may be used before EXP as in the “print” command.
/FMT “i” or “s” or including a size-letter is allowed,
as in the “x” command, and then EXP is used to get the address to examine
and examining is done as in the “x” command.

With no argument, display all currently requested auto-display expressions.
Use “undisplay” to cancel display requests previously made.

One can use the display command to view the next instruction that is about to be executed.  The pointer to the instruction yet to be executed is stored in the computer’s program counter (also known as the instruction pointer).   The following command will show the next 3 instructions that are pointed to by the program counter.

display /3i $pc

The /3i above causes three instructions to be printed and $pc references the program counter register.  A sample output is shown below.

1: x/3i $pc

0x401175 <main+37>:     call   0x4103f0 <__main>
0x40117a <main+42>:     lea    0xffffffe8(%ebp),%eax
0x40117d <main+45>:     mov    %eax,(%esp)
(gdb)


Aliases In Visual Studio’s Command Window

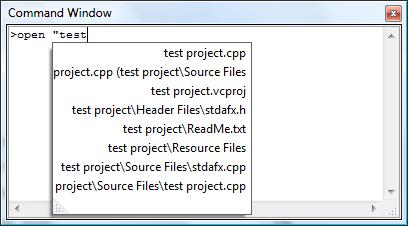
One trick I picked up from fellow developers was to open a file real quick in Visual Studio.  The trick was to go to the Command Window and type open <filename>.  This is a great productivity tip as you don’t have to search the file through the Solution Explorer.  And if you miss the command prompt after having worked with debuggers such as gdb, this is a must try feature.  Try this in a huge code base and you will come to appreciate it as well.

I then explored the Command Window in more depth and found out that it has some real nice commands which save you a lot of mouse clicks and time.

The Command Window is available through the shortcut CTRL + A or through the Menu ( View -> Other Windows -> Command Window).

Visual Studio 2005 Command Window

Instead of the open command you could also have used the File.OpenFile command (analogous to Menu->File->Open File).  However the Command Window is not just an alternate way of accessing the menu.

The Command Window provides the ability to use aliases and to create new ones.  This is what makes it very powerful and useful.  open in the above example is an alias for File.OpenFile.  It is easy to remember and type in.

Visual Studio has a lot of predefined aliases and below are some that I found very useful.

alias     : lists all existing alias or creates a new alias.
cls       : clears the text from the Command Window.
disasm    : switches to disassembly view.
code      : switches to the code view.
bp        : toggle an existing breakpoint.
? <var>   : prints the value of the variable.
?? <var>  : displays the variable in the quickwatch window.
open file : opens the file and supports auto-complete.
nf        : new file.
closeall  : close all open windows.
|         : list processes.
~         : list threads.
r         : list registers.
g         : run program.
q         : stop debugging.


New aliases can be set by using the alias command and the auto-complete facilitates this.  They continue to persist even after you have exited Visual Studio.  For example, the following command will create an alias only  that will close all files except for the active one.

alias only File.CloseAllButThis

Many aliases in the Command Window do the task that can also be performed with keyboard shortcuts.  Aliases are not meant to replace keyboard shortcuts or menu items but provides an alternative way of debugging in Visual Studio which is intuitive to those who have worked on command line interfaces.  Some commands such as only  (created above) are more easily used through the Command Window whereas others might be more accessible through keyboard shortcuts.