If you work on multiple platforms and use different debuggers, you are expected to know the debugger’s user interfaces well enough. At times this gets confusing especially if you have one primary platform and you work on other platforms rather infrequently.
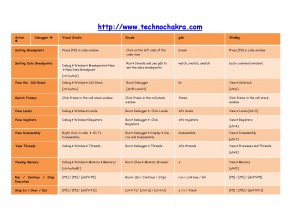
I have compiled a list of my favorite features in a debugger and how to invoke them on different debuggers (Visual Studio, XCode, gdb and Windbg).
This is not a substitute for the debugger’s documentation but helpful for quickly switching to an unfamiliar debugging environment. Click the image below for viewing the table or download the PDF version as a ready reference.
Debugger Cheat Sheet (Download PDF)
Please note :
- The commands (especially for gdb) are not necessarily complete and the debugger’s help should be consulted for detailed usage.
- The list is not comprehensive and I have only put in my favorite commands that I use while debugging.
- A square bracket [ ] denotes a keyboard shortcut.


Hello,
Because a lot of people are not able to use gdb 😉 therefore we’ve prepared an add-in to debug Linux/MinGW applications under Visual Studio (with gdb as back-end of course).
Kind regards,
WinGDB team