While running your program in memory intensive workflows, you may often run into a situation where the low memory condition starts to thrash the system. Such a program usually exhibits a performance problem as it has consumed most of its available virtual memory. Developers often use their favorite profilers to figure out the performance bottlenecks though profilng such programs is difficult and sometimes impractical. A lot of good profilers crash when collecting data in such situations. They need additional memory and resources to collect and consolidate the data which makes the situation even worse.
The good thing about a program that is thrashing a system is that it tends to be in the slow portion of the code for a long period of time. So when it is bringing down the system, it is mostly executing the code that is responsible for the situation and all we want is to take a peek at the call stack at that very moment. An obvious choice is to use a debugger or a profiler but given the low memory condition of the system, one may get little help from such tools. When debugging or profiling become painfully slow, people may get evil ideas of reformatting their system or may start comparing their state of the art machines with ones they had five years back :). This article describes a light weight profiling trick where one can get the call stack of the unresponsive program without really loading the system further.
Procexp (Process Explorer) is a tool from sysinternals (now Microsoft) and both the download and documentation is available at the link here (Microsoft’s site).
The tool allows one to view the call stack of any running program on the system. Below are the steps needed to display a call stack of any running program.
- Launch procexp.
- In the process tree, find your process that is thrashing the system.
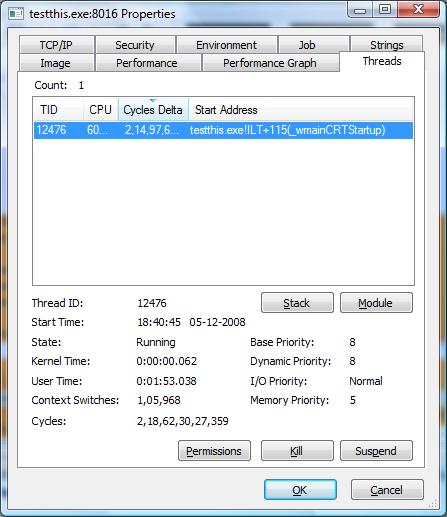
- Right click on “Properties” and select the “Threads” tab.
procexp threads tab - Sort the “Cycles Delta” (on Vista) or “CSwitch Data” (on Windows XP) column in descending order and select the topmost thread. For some programs there might be just one thread.
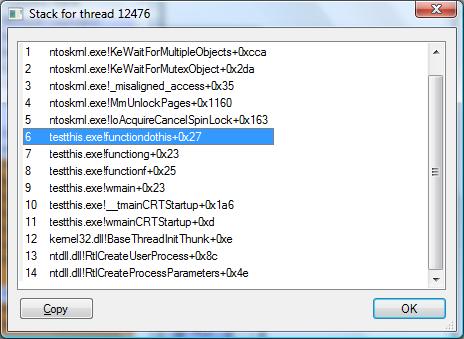
- For the selected thread click on the stack button to see the current call stack of the program. Do note that this is a snapshot of the call stack and does not change dynamically.
procexp call stack
This call stack can provide a good insight of the area of the code that is causing the system to stall. In the example above functiondothis() is where the thread is spending the most time. Take more than one sample to reconfirm the findings. This is a very unintrusive and light weight method of getting a call stack of a running program. The same trick can be used to debug a hang but there a debugger works equally well.
Sometimes you don’t need heavy debugging tools and sometimes you just can’t use them. Procexp is a nifty debugging utility (in addition to being a process explorer) that a developer should download and keep handy for times when nothing else works.


