Performance issues usually take the longest to resolve and require a lot of patience, luck and testing iterations before a satisfactory outcome is reached. Performance tuning is a part of most development projects that have a substantial code base or do a very CPU intensive job.
This article provides few basic tips that development and testing teams can perform to reduce the time required to resolve such issues.
Reproduce The Performance Issue
Well this is true for any bug but more so for performance issues. Time reported in an original bug report may not necessarily match with that on a tester’s machine which in turn won’t necessarily match with that on a developer’s machine. These numbers depend on the state of a machine, the hardware used and the version of the software being used to report the problem.
Therefore it is important to recalibrate the numbers with the latest sources and see whether the percentage of degradation reported matches with the original bug report or not.
Find A Build Or Change That Introduced The Issue
A performance issue does not necessarily require intense profiling to arrive at the cause of the issue. At times it is important to be able to identify the build number or the change in source code that has caused the degradation. Knowing a range of changes or the exact change that caused the degradation amounts to solving half the problem.
The maximum time taken to resolve performance problems is finding the bottleneck and the rest goes into solving the problem itself. A profiler is not the only quickest means to find the bottleneck. The testing team can easily identify the build where the problem was first introduced. Likewise, the development team should try to narrow down on the exact source change that introduced the problem.
Use Release Builds Only
Do not compute performance results or perform investigations on a debug build. With optimizations turned off and extra debug code, numbers from debug builds are neither accurate nor reliable.
The reason many teams use the debug build is because the profiles generated using debug symbols look more meaningful to them as programmers. Use a release build with debug symbols instead.
Use The Same Machine
If you are comparing performance between two different versions, use the same machine to compute the numbers. This ensures that differences in processor speed, state of the machine, etc do not play a role in the difference in timings.
Catch Issues Early
The testing team should regularly run performance tests and report issues immediately. This is a huge time saver and helps narrow down the problematic code early. All results and binaries used during the testing should be preserved so that if any issue if found late in the cycle, it should still be possible to narrow down the problematic build number.
Performance suites take time to evolve but the time spent in putting one together is worth the dividends it pays in the long run.
Profile And Know Your Profiler
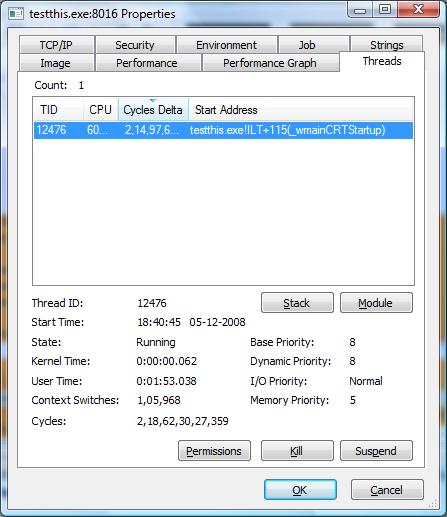
Though it may sound simple to narrow down the source and solve a performance issue, it is pretty common practice to use a profiler to determine the bottlenecks in code. The idea is not to jump to the step of profiling without trying to narrow down problems through other means. Once you know you require a profiler, make sure you understand the technique your profiler uses behind the scenes.
Some profilers “instrument” code and insert extra code to collect the timing information. Profilers of this category are accurate for relative comparison but may crash if they do a bad job at instrumenting the code.
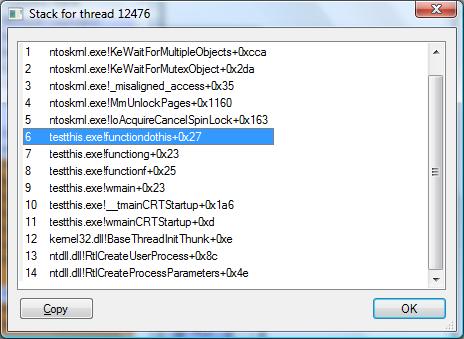
Some profilers “sample” the state of the program by collecting the call stack of the program at regular intervals. These profilers indicate the area of the code where the program spends the maximum time without modifying the running program. Here the sample interval and duration of sampling determine the usefulness of the generated profile.
It is important to understand how your profiler collects the data which further aids in its better interpretation.
Conclusion
Performance and profiling do go together but it helps to execute a few steps and to setup some processes in a development cycle that quickly and accurately help in narrowing down the source of the problem.


